Macular atrophy after anti-VEGF therapy appears in a sizable share of eyes with neovascular AMD, and it can limit the visual gains from treatment.
Whether the drugs cause the atrophy or merely uncover the natural course is still debated.
Understanding the risk factors helps to counsel patients and to choose treatment regimens.
What Macular Atrophy After Anti-VEGF Is
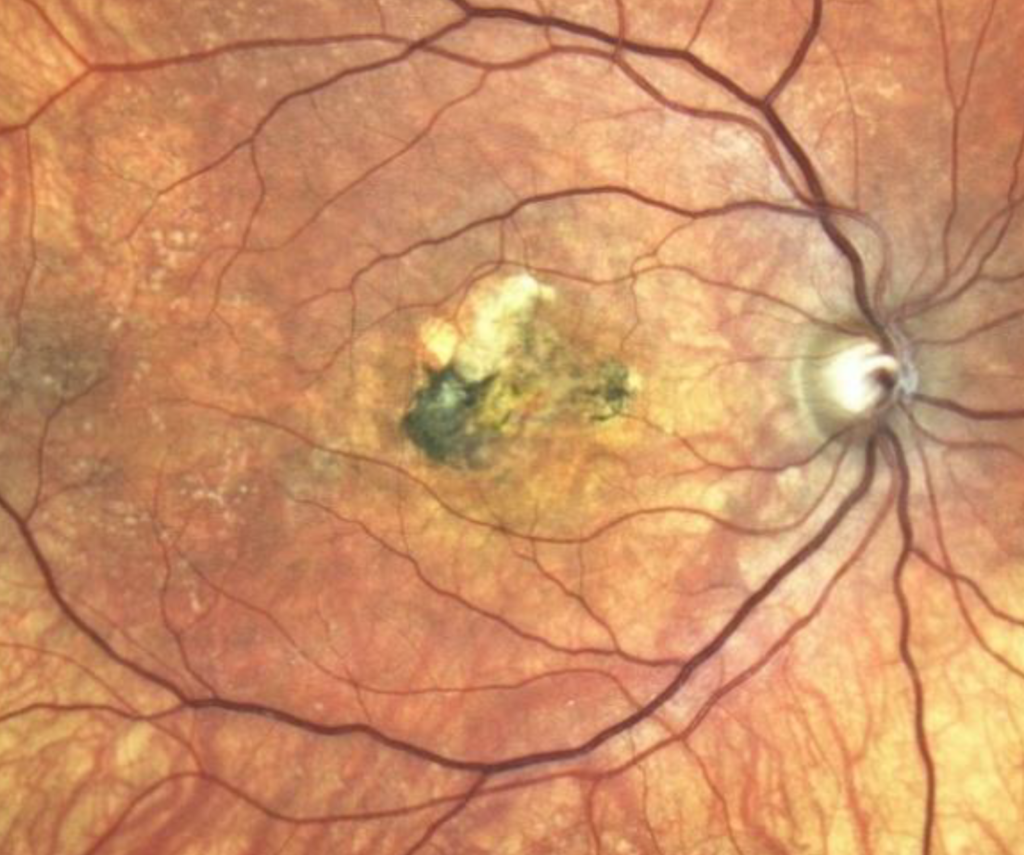
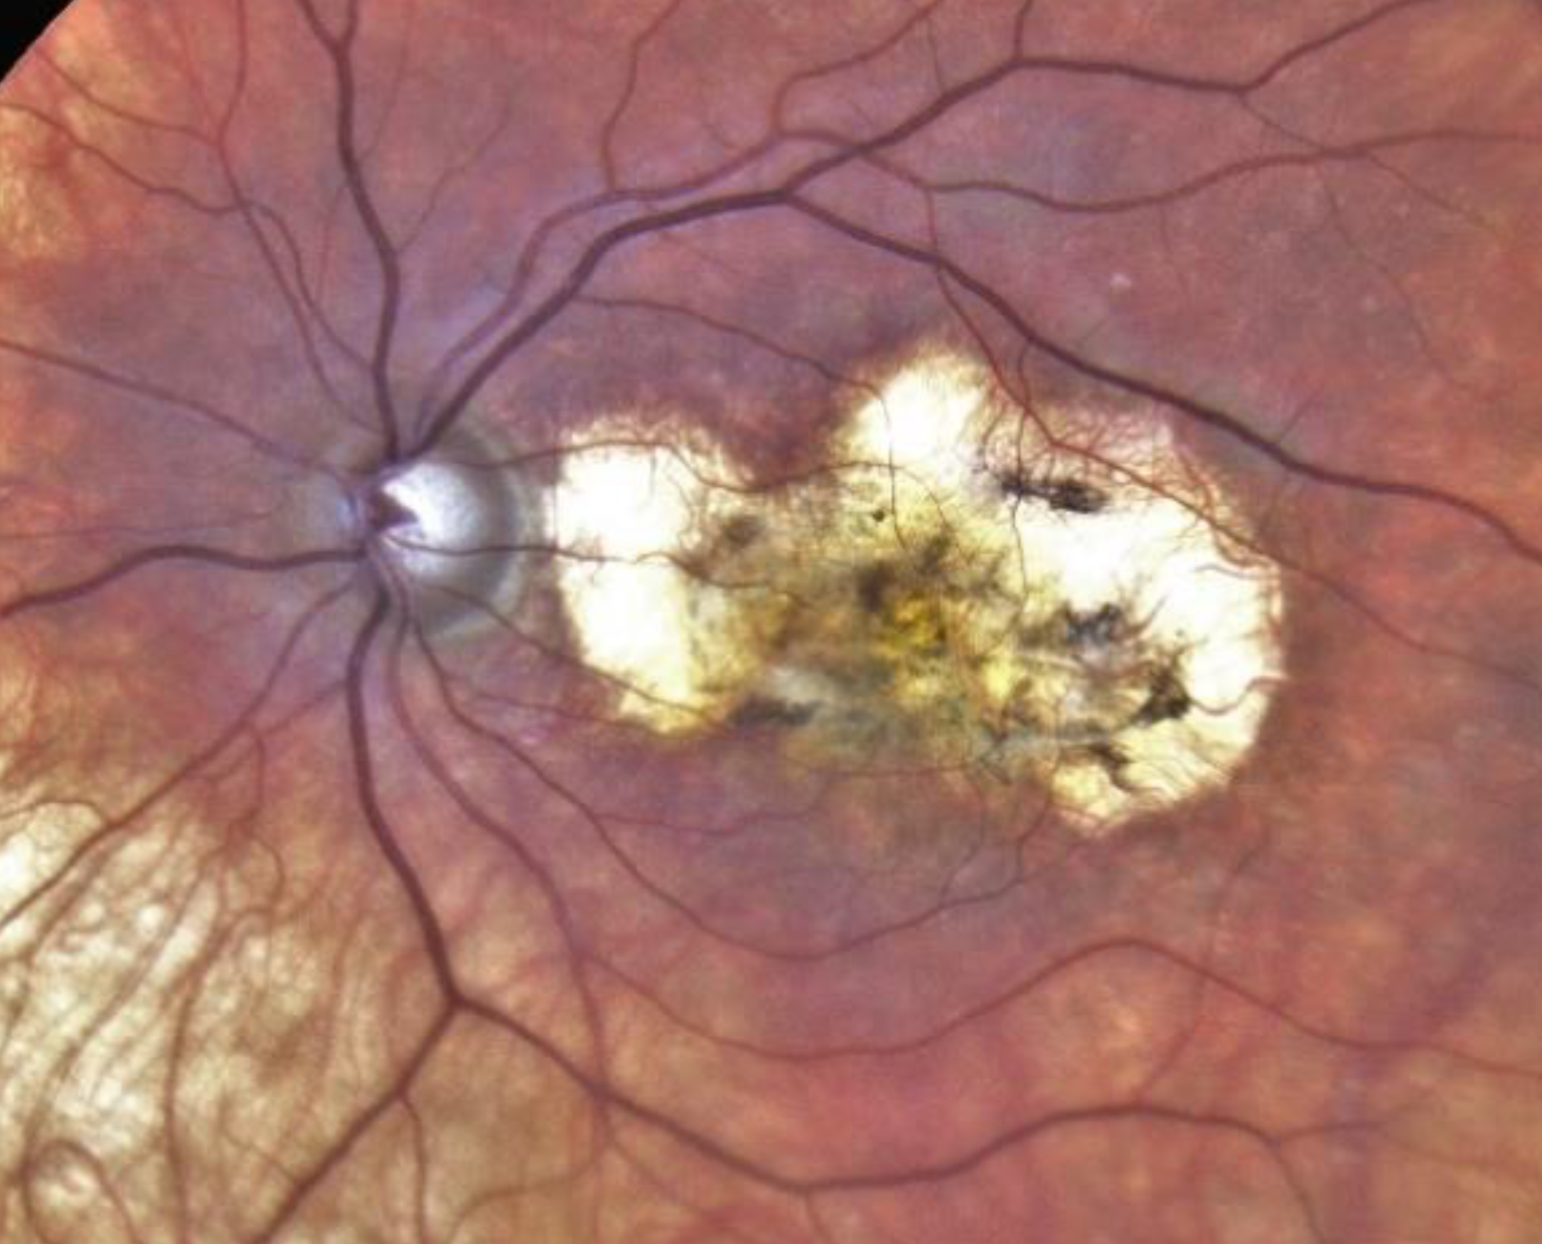
Atrophy refers to loss of the RPE, the photoreceptors, and the choriocapillaris in a defined area.
Many eyes with neovascular AMD develop atrophy as the lesion matures, with or without treatment.
Grunwald and colleagues followed the CATT cohort and showed that geographic atrophy developed in a substantial minority of eyes by two years (see geographic atrophy).
Findings in CATT and HARBOR on Macular Atrophy After Anti-VEGF
In CATT, the incidence grew over the five years of follow-up, with the largest numbers in later years.
Eyes treated monthly with ranibizumab had a higher risk than those treated as needed in the two-year analysis.
In HARBOR, Sadda and colleagues found macular atrophy in about one in five eyes by two years, with similar rates across dosing groups.
Gemenetzi and colleagues reviewed these studies and cautioned that evidence for a causal effect is limited.
Fundus Explorer Pro
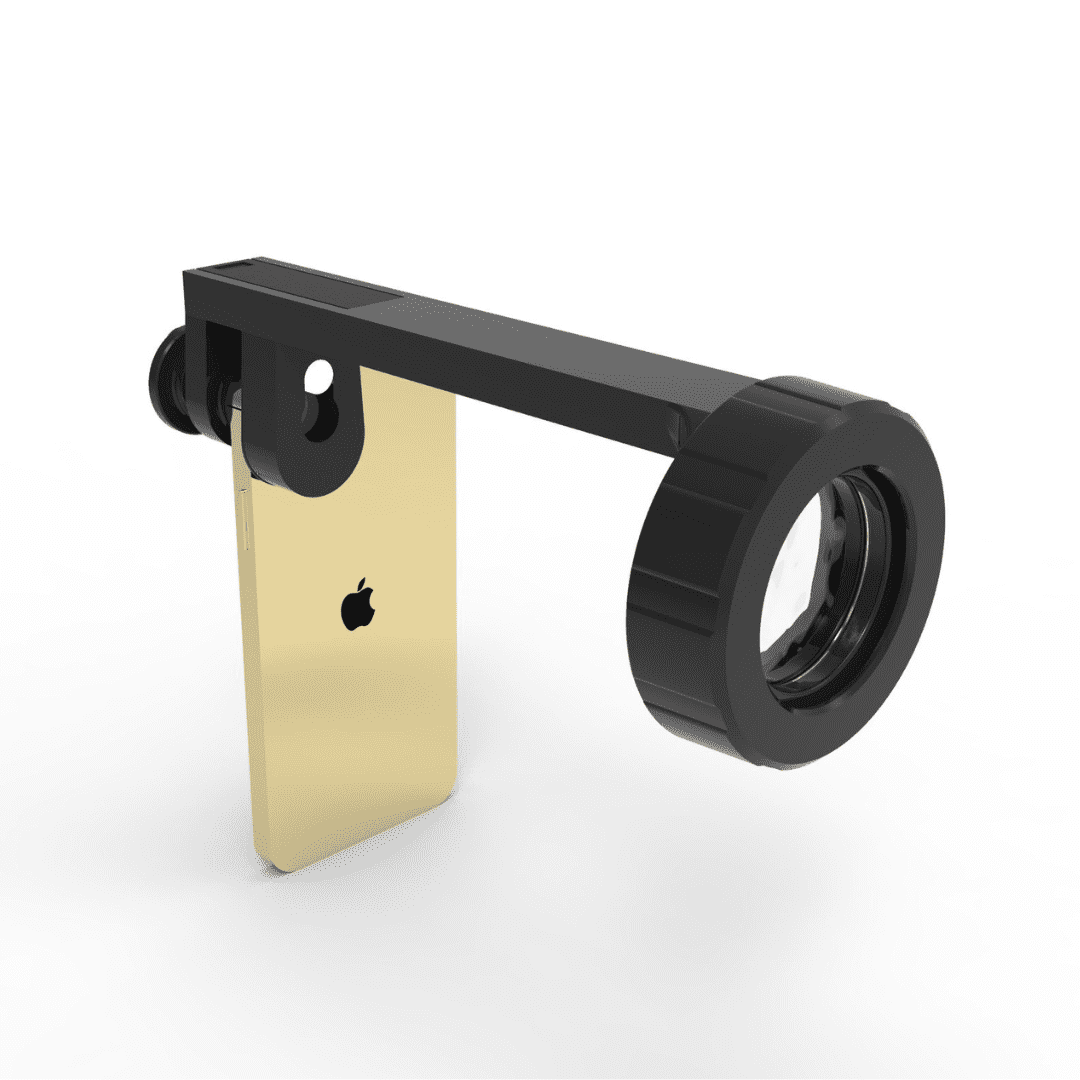
Photograph the retinal findings described here with the phone already in your pocket — 22 D optics and built-in illumination in one handheld unit.
From Choroida — the team behind this siteRisk Factors for Macular Atrophy After Anti-VEGF
- Atrophy in the fellow eye
- Type 3 neovascularization and retinal angiomatous proliferation
- Pigment epithelial detachment and reticular pseudodrusen
- Larger lesion area at baseline
Intense anti-VEGF dosing may add to the risk in susceptible eyes (see retinal angiomatous proliferation).
Causality in Macular Atrophy After Anti-VEGF
Several observations suggest that VEGF supports the choriocapillaris, so strong suppression may harm it.
However, atrophy also occurs in untreated eyes, and many risk factors are intrinsic.
Randomized trials were not designed to prove a causal link, so uncertainty remains.
Practical Approach to Macular Atrophy After Anti-VEGF
- Document baseline atrophy and fellow eye status
- Use the lowest frequency that controls fluid
- Avoid overtreatment of small amounts of stable fluid
- Counsel patients on realistic expectations
Do not stop effective treatment solely because of fear of atrophy, since neovascular disease causes greater harm when untreated (see anti-VEGF therapy).
An Example Case
A 74-year-old woman receives monthly ranibizumab for neovascular AMD in her right eye for two years.
Her acuity improves from 20/80 to 20/40, and OCT shows a dry macula.
By year three, a patch of geographic atrophy has formed beside the scar, and her acuity falls to 20/60.
The clinician extends the interval, explains the findings, and refers her for low vision aids.
Questions Patients Ask
Patients ask whether the injections caused the atrophy, and the honest answer is that it is possible but unproven.
They also ask whether they should stop injections, and stopping would risk new fluid and bleeding.
Because the news is hard, give a clear plan and a follow-up date.
Pitfalls to Avoid
- Stopping treatment solely because atrophy appeared
- Continuing monthly injections for a dry macula without a reason
- Missing early atrophy on autofluorescence
- Failing to warn patients about this risk before treatment
Looking Ahead
Trials of complement inhibitors may help patients with geographic atrophy in the future.
Also, treatment regimens with fewer injections may lower the risk, though evidence is limited.
Therefore, individualized dosing is the sensible direction.
Practical Points
Obtain baseline autofluorescence and OCT before treatment.
Then repeat imaging at six-month or yearly intervals.
Also use treat-and-extend schedules to lower the number of injections.
Atrophy and Vision
Atrophy that spares the fovea may cause mild loss, while foveal involvement is severe.
Its growth rate depends on baseline size and location.
Because vision depends on foveal sparing, follow the location carefully.
Documenting Atrophy
Measure the area with autofluorescence or OCT in each eye.
Compare images over time to calculate growth.
Then share the results with patients to help them plan.
Imaging Atrophy
Autofluorescence shows atrophy as a dark area with sharp edges.
OCT shows loss of the RPE and outer retina with increased transmission into the choroid.
Because both views help, use them together.
Also measure the area over time to estimate growth.
Discussing Atrophy With Patients
Explain that neovascular disease and atrophy are two parts of AMD and that treatment controls only the first.
Then describe the plan for monitoring and low vision support.
Because honest information supports trust, share the data openly.
Document what you see
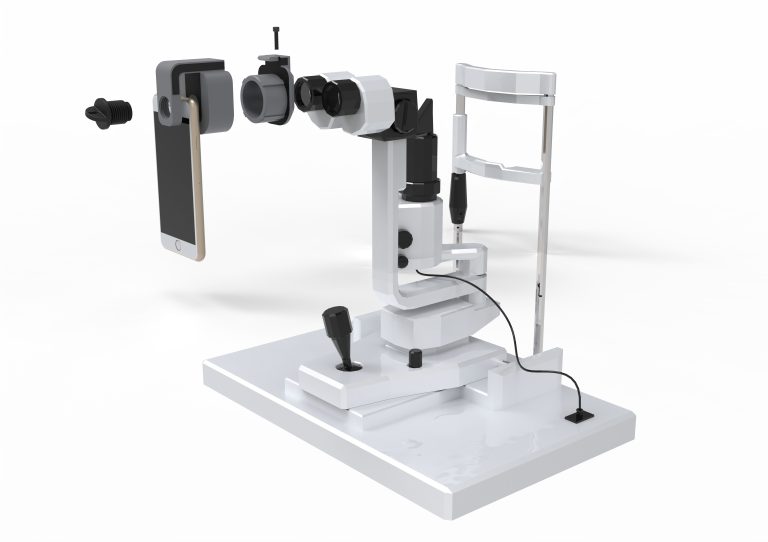
Two smartphone imaging tools built for everyday clinic use — one for the slit lamp, one for the fundus.
From Choroida — the team behind this siteReferences
- Grunwald JE, Daniel E, Huang J, et al. Risk of geographic atrophy in the Comparison of Age-related Macular Degeneration Treatments Trials. Ophthalmology. 2014;121:150-161.
- Grunwald JE, Pistilli M, Daniel E, et al. Incidence and growth of geographic atrophy during 5 years of Comparison of Age-Related Macular Degeneration Treatments Trials. Ophthalmology. 2017;124:97-104.
- Sadda SR, Tuomi LL, Ding B, et al. Macular atrophy in the HARBOR study for neovascular age-related macular degeneration. Ophthalmology. 2018;125:878-886.
- Gemenetzi M, Lotery AJ, Patel PJ. Risk of geographic atrophy in age-related macular degeneration patients treated with intravitreal anti-VEGF agents. Eye. 2017;31:1-9.

Writes and reviews the clinical articles on Educate. Every post is checked against peer-reviewed sources before it goes live.