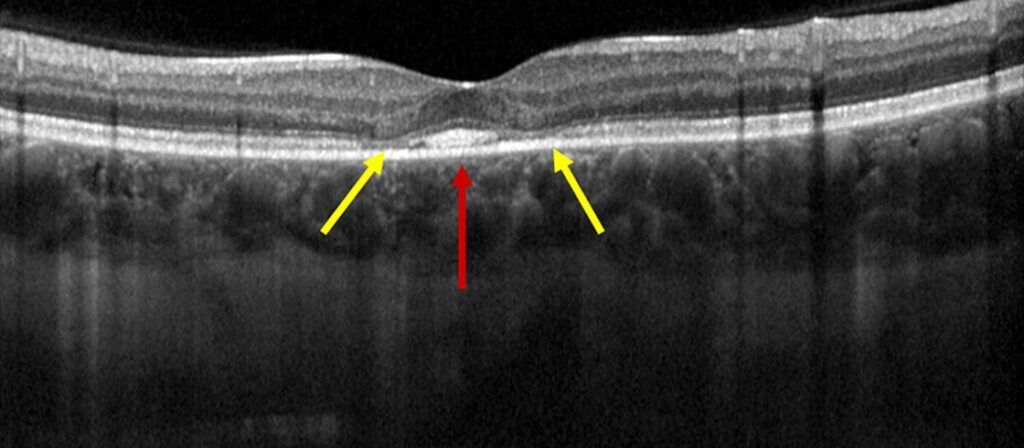
Flying saucer sign describes a preserved foveal center flanked by perifoveal outer retinal loss on macular OCT.
Clinicians link it most closely to hydroxychloroquine (Plaquenil) retinopathy.
Because it reflects photoreceptor damage, it should prompt a full toxicity assessment (see hydroxychloroquine toxicity).
What the Flying Saucer Sign Looks Like
On a foveal B-scan, the outer retina stays relatively intact beneath the center.
On both sides, however, the ellipsoid zone fades and the outer nuclear layer thins.
As a result, the spared segment takes on an oval, saucer-like profile.
Chen and colleagues popularized the name in 2010.
Why the Sign Forms
Hydroxychloroquine binds melanin and accumulates in pigmented ocular tissue.
Over long exposure, it appears to disturb retinal pigment epithelium (RPE) and photoreceptor function.
Toxic loss often begins in a parafoveal ring, while the fovea survives longer.
However, the reason for this regional vulnerability is incompletely understood.
Fundus Explorer Pro
Photograph the retinal findings described here with the phone already in your pocket — 22 D optics and built-in illumination in one handheld unit.
From Choroida — the team behind this siteFlying Saucer Sign and Disease Stage
Early toxicity may show only subtle parafoveal ellipsoid zone attenuation.
A well-defined saucer usually indicates more established photoreceptor loss.
RPE loss suggests advanced disease and a greater risk of progression after stopping the drug.
Symptoms and Fundus Findings
Many patients with early structural change report no symptoms.
Others describe missing letters while reading, because paracentral scotomas interrupt fixation.
Visual acuity may stay good while the foveal center survives.
Therefore, 20/20 acuity offers no reassurance about a damaged parafovea.
The fundus can look normal when OCT already shows outer retinal loss.
Later, a bull’s eye pattern may appear, so screening should never rely on ophthalmoscopy.
Reading the Flying Saucer Sign on OCT
First, review scans passing exactly through the foveal center.
Next, trace the ellipsoid zone toward the arcades in horizontal and vertical planes.
Compare both eyes, because toxicity is usually symmetric.
In addition, en face OCT can show the distribution of damage in plan view.
A review of ellipsoid zone disruption also helps when the band looks patchy.
Confirming Toxicity With Other Tests
Automated 10-2 visual fields often reveal a matching paracentral or ring scotoma.
Fundus autofluorescence then maps photoreceptor and RPE damage across a wider area.
When fields seem unreliable, multifocal electroretinography offers objective support.
Concordant findings make the diagnosis much stronger than one abnormal test.
When the Sign Is Absent
Normal parafoveal anatomy does not exclude toxicity.
Melles and Marmor described a pericentral pattern, particularly in Asian patients.
Therefore, inspect the full OCT width near the arcades.
Wider fields, such as 24-2 or 30-2, may detect this distribution.
Risk Factors and Screening
Daily dose above 5 mg/kg real body weight raises risk, as does longer exposure.
In addition, kidney disease and concurrent tamoxifen use increase the likelihood of toxicity.
Pre-existing macular disease also complicates interpretation.
The 2016 American Academy of Ophthalmology recommendations advise a baseline examination in the first year.
Annual screening then begins after five years, or sooner with major risk factors.
Differential of the Flying Saucer Sign
Cone and cone-rod dystrophies can produce similar central outer retinal changes, often with earlier acuity loss.
Stargardt disease may also cause atrophy with foveal sparing, usually alongside flecks.
Next, consider age-related macular degeneration when drusen or geographic atrophy accompany the loss.
Drug history, symmetry and autofluorescence usually separate these conditions.
Managing a Flying Saucer Sign
No treatment restores photoreceptors lost to hydroxychloroquine toxicity.
Management therefore focuses on confirming the diagnosis and limiting further exposure.
Contact the prescribing physician promptly, because stopping the drug may risk a systemic disease flare.
The rheumatologist weighs alternatives, while the ophthalmologist supplies the retinal evidence.
Together, they should reach a documented decision with the patient.
Stopping limits new exposure, yet it cannot reverse established damage.
Mititelu and colleagues documented continued progression after cessation, especially in advanced disease.
Counseling and Follow-Up
Show the OCT and explain that the central retina is preserved while the surrounding ring is damaged.
Then explain that reading problems may persist despite good chart acuity.
Advise patients to keep taking the medication until the prescriber gives instructions.
Repeat OCT, autofluorescence and visual fields at intervals based on severity.
Watch for narrowing of the preserved center, new RPE loss and scotoma enlargement.
Pitfalls to Avoid
- Do not dismiss the sign because acuity is normal
- Avoid reviewing only the central few OCT cuts
- Do not diagnose toxicity from OCT alone
- Never tell a patient to stop treatment without the prescriber
Document what you see
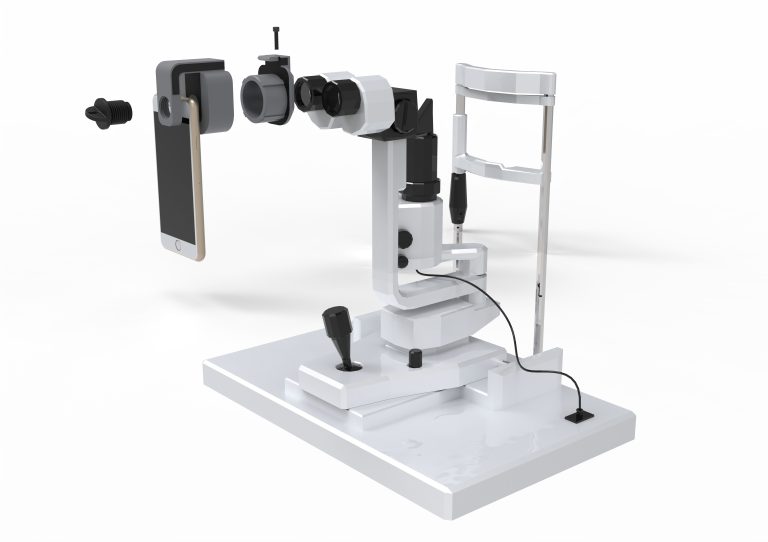
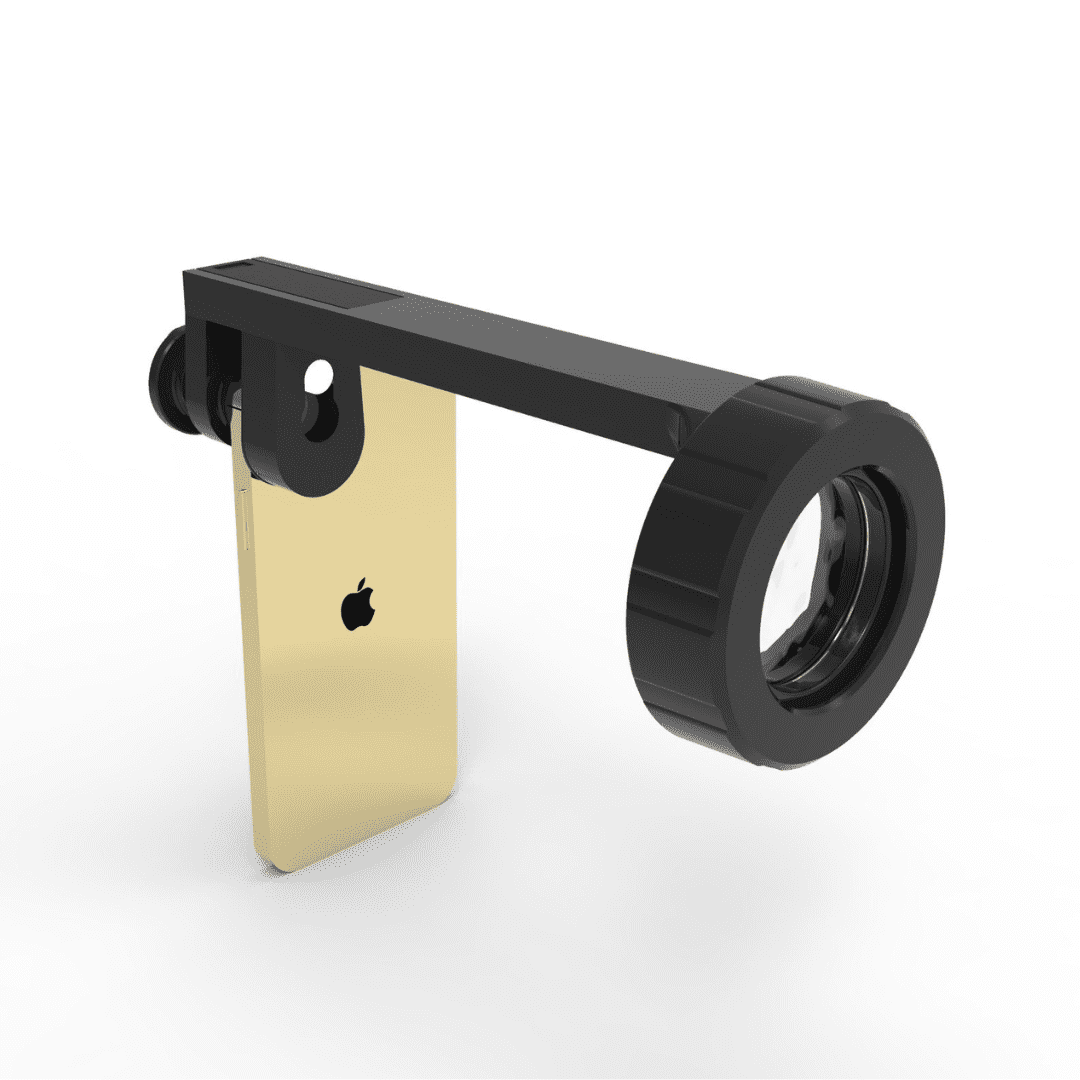
Two smartphone imaging tools built for everyday clinic use — one for the slit lamp, one for the fundus.
From Choroida — the team behind this siteReferences
- Chen E, Brown DM, Benz MS, et al. Spectral domain optical coherence tomography as an effective screening test for hydroxychloroquine retinopathy (the “flying saucer” sign). Clin Ophthalmol. 2010;4:1151-1158.
- Marmor MF, Kellner U, Lai TYY, Melles RB, Mieler WF. Recommendations on screening for chloroquine and hydroxychloroquine retinopathy (2016 revision). Ophthalmology. 2016;123:1386-1394.
- Melles RB, Marmor MF. The risk of toxic retinopathy in patients on long-term hydroxychloroquine therapy. JAMA Ophthalmol. 2014;132:1453-1460.
- Melles RB, Marmor MF. Pericentral retinopathy and racial differences in hydroxychloroquine toxicity. Ophthalmology. 2015;122:110-116.
- Mititelu M, Wong BJ, Brenner M, et al. Progression of hydroxychloroquine toxic effects after drug therapy cessation: new evidence from multimodal imaging. JAMA Ophthalmol. 2013;131:1187-1197.

Writes and reviews the clinical articles on Educate. Every post is checked against peer-reviewed sources before it goes live.