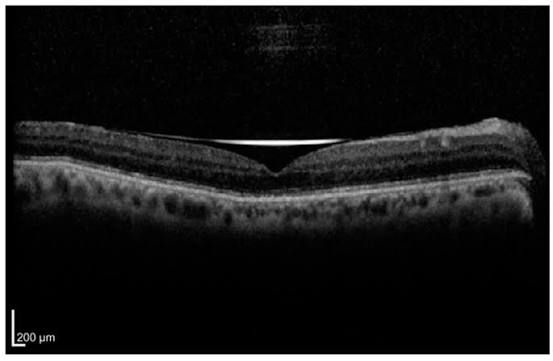
Ellipsoid zone disruption on OCT means a break, thinning, or loss of the second outer retinal hyperreflective band, and it is one of the most useful structural markers of photoreceptor damage.
The band is bright because of the dense mitochondria in the ellipsoid portion of the photoreceptor inner segments.
When it is intact, the photoreceptors are usually functioning, and when it is lost, vision often falls in the corresponding area.
Reading the ellipsoid zone correctly helps with diagnosis, prognosis, and follow-up, and it also protects against mistaking a scanning artifact for disease.
What Is the Ellipsoid Zone?
The band that used to be called the IS/OS junction was reassigned after anatomic correlation work showed that it corresponds to the ellipsoid zone of the inner segment.
The four outer retinal bands, from inner to outer, are the external limiting membrane, the ellipsoid zone (EZ), the interdigitation zone, and the RPE-Bruch membrane complex.
The EZ is most prominent at the fovea, where cone density is highest, and it becomes fainter toward the periphery.
Loss of the EZ indicates photoreceptor dysfunction or death, or damage to the mitochondria in the inner segment.
EZ integrity has been used as an endpoint in trials of inherited retinal disease, since it can be measured objectively and repeatedly.
Patterns of Disruption
The pattern often points to the diagnosis.
- Focal foveal loss in solar retinopathy, laser injury, and trauma
- Parafoveal ring of loss with preserved foveal center in hydroxychloroquine toxicity, where the retina outside the fovea is damaged first (see hydroxychloroquine toxicity)
- Progressive centripetal shrinkage to a central island in retinitis pigmentosa, where the EZ boundary marks the edge of functioning retina (see retinitis pigmentosa)
- Central loss with preserved parafovea in Stargardt disease and some cone dystrophies (see Stargardt disease)
- Patchy loss in inflammatory outer retinopathies such as AZOOR and MEWDS, where recovery is sometimes possible (see AZOOR)
- Loss over drusen or atrophy in AMD
- Loss beneath fluid or edema in central serous chorioretinopathy, macular edema, and vein occlusion
Fundus Explorer Pro
Photograph the retinal findings described here with the phone already in your pocket — 22 D optics and built-in illumination in one handheld unit.
From Choroida — the team behind this siteCauses of Ellipsoid Zone Disruption
- Inherited retinal dystrophies
- Toxic maculopathy, including hydroxychloroquine, tamoxifen, and pentosan polysulfate (see pentosan polysulfate maculopathy)
- Photic injury from the sun or lasers (see solar retinopathy)
- Blunt trauma, including commotio retinae (see commotio retinae)
- Retinal ischemia, including acute macular neuroretinopathy and vein or artery occlusion
- Macular hole and vitreomacular traction
- Chronic macular edema
- Central serous chorioretinopathy
- Retinal detachment, where photoreceptor outer segments degenerate
- Inflammatory outer retinopathies
- Age-related macular degeneration and geographic atrophy
Most of these disturb the EZ in one of two ways: by damaging the photoreceptor itself or by separating it from the RPE.
Prognostic Value
Macular Hole
After successful macular hole surgery, restoration of the EZ correlates with visual recovery.
Eyes in which the EZ does not recover tend to have a poorer final acuity.
Retinal Detachment and Central Serous Chorioretinopathy
Recovery of the outer retinal bands after macula-off detachment or chronic serous fluid follows the resolution of fluid over months, and the degree of recovery parallels the return of vision.
Retinitis Pigmentosa
The width of the residual EZ correlates with visual field extent and retinal sensitivity.
Measuring the EZ over time provides an objective marker of disease progression.
Toxic Maculopathy
EZ loss in the parafovea signals established toxicity, and it is the reason OCT is recommended in screening for hydroxychloroquine retinopathy.
Damage detected at this stage is often irreversible, though progression may slow after stopping the drug.
Limits
The EZ is a structural marker and does not replace functional testing.
Patients with an intact EZ can have reduced acuity because of inner retinal or cortical disease, and patients with a broken EZ may retain surprisingly good vision in the short term.
Artifacts That Mimic Ellipsoid Zone Loss
Several artifacts cause apparent EZ loss.
- Oblique beam entry: when the OCT beam is not perpendicular to the photoreceptors, the outer bands can look faint or interrupted, and the Henle fiber layer becomes hyperreflective
- Poor signal: media opacity and dry eye reduce band contrast
- Segmentation error: software may misidentify the band in en face maps
- Shadowing: vitreous opacities, blood, or vessels can shadow the outer retina
To avoid these errors, repeat the scan with the beam centered through the pupil, compare adjacent B-scans, and confirm the finding in the fellow eye and in previous scans.
En face EZ maps are useful for measuring area, but they depend on the quality of the underlying scans.
Reporting Ellipsoid Zone Findings
A useful OCT report states the location, the extent, and the pattern of EZ loss, together with the state of the ELM and interdigitation zone.
Measuring the horizontal width of the preserved EZ, or its area on an en face map, gives a number that can be compared over time.
The report should also mention associated findings, such as fluid, vitreous traction, or drusen, since these affect interpretation.
The scan quality and any suspected off-axis artifact should be noted, so that later readers do not mistake an artifact for progression.
Management
Treatment depends on the cause.
Toxic maculopathy requires stopping the drug when possible, in consultation with the prescribing physician.
Macular holes and detachments are repaired surgically, and central serous chorioretinopathy may be treated with photodynamic therapy or observation.
For inherited diseases, care centers on diagnosis, genetic counseling, and eligibility for trials.
Serial OCT scans document change, and patients should be told that structural recovery, when it occurs, is slow and may lag behind visual recovery.
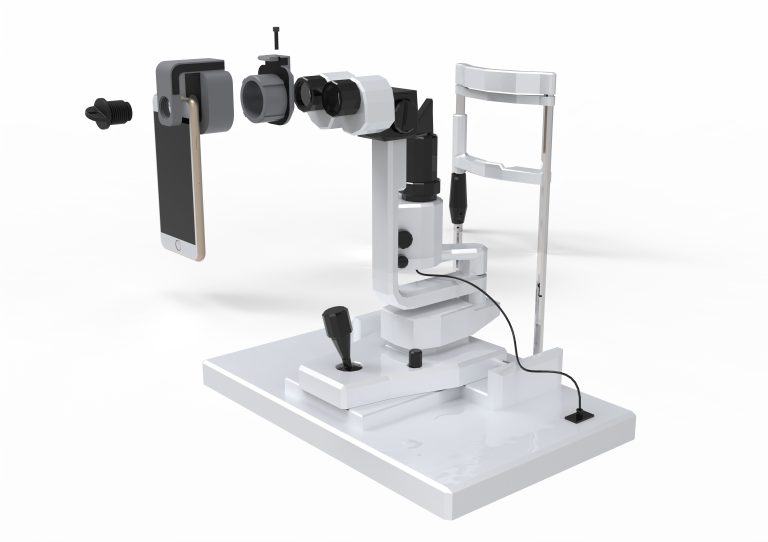
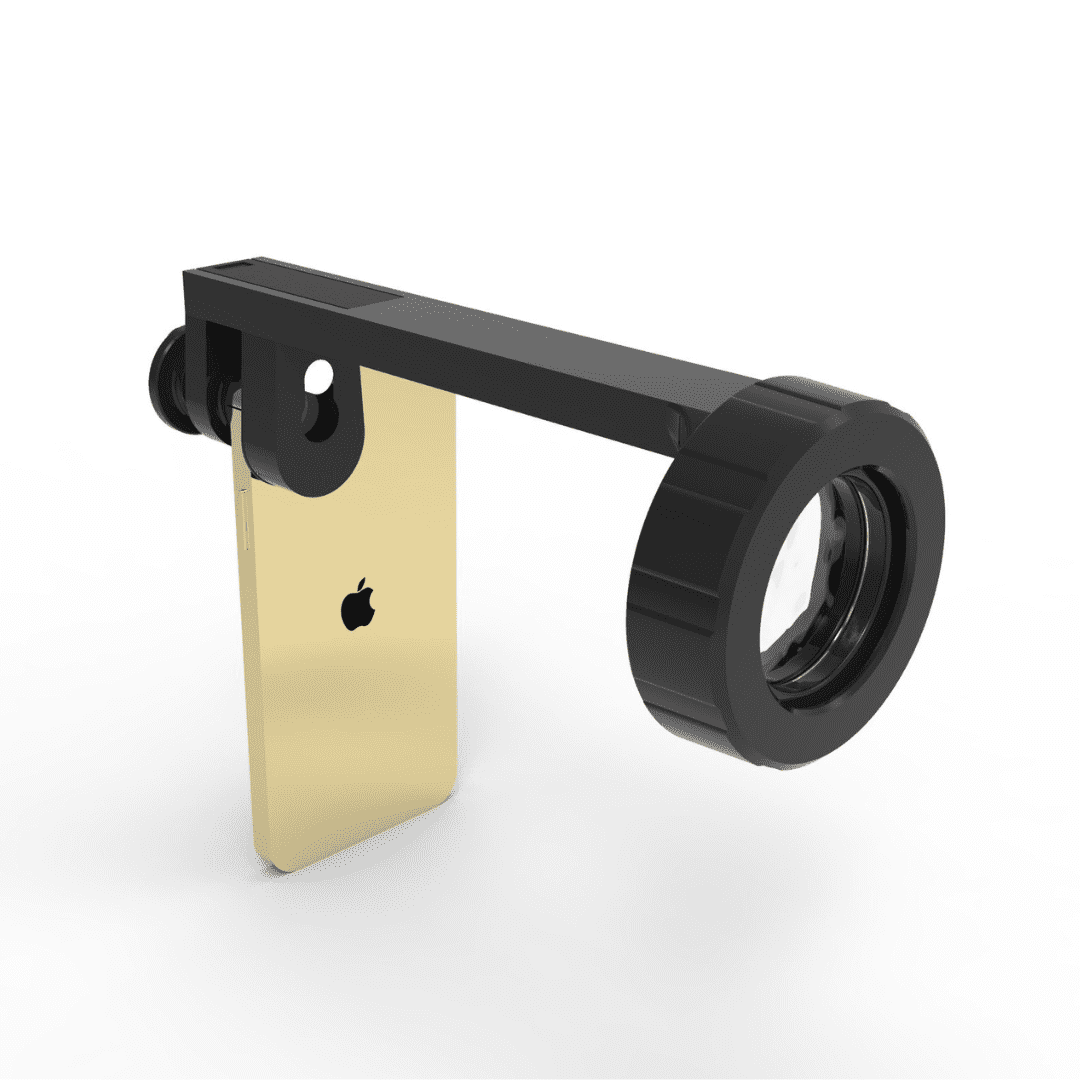
Document what you see
Two smartphone imaging tools built for everyday clinic use — one for the slit lamp, one for the fundus.
From Choroida — the team behind this siteReferences
- Spaide RF, Curcio CA. Anatomical correlates to the bands seen in the outer retina by optical coherence tomography: literature review and model. Retina. 2011;31:1609-1619.
- Staurenghi G, Sadda S, Chakravarthy U, Spaide RF; International Nomenclature for Optical Coherence Tomography (IN-OCT) Panel. Proposed lexicon for anatomic landmarks in normal posterior segment spectral-domain optical coherence tomography: the IN-OCT consensus. Ophthalmology. 2014;121:1572-1578.
- Hood DC, Lin CE, Lazow MA, Locke KG, Zhang X, Birch DG. Thickness of receptor and post-receptor retinal layers in patients with retinitis pigmentosa measured with frequency-domain optical coherence tomography. Invest Ophthalmol Vis Sci. 2009;50:2328-2336.
- Sano M, Shimoda Y, Hashimoto H, Kishi S. Restored photoreceptor outer segment and visual recovery after macular hole closure. Am J Ophthalmol. 2009;147:313-318.
- Marmor MF, Kellner U, Lai TY, Melles RB, Mieler WF; American Academy of Ophthalmology. Recommendations on screening for chloroquine and hydroxychloroquine retinopathy (2016 revision). Ophthalmology. 2016;123:1386-1394.
- Lujan BJ, Roorda A, Knighton RW, Carroll J. Revealing Henle’s fiber layer using spectral domain optical coherence tomography. Invest Ophthalmol Vis Sci. 2011;52:1486-1492.
Test yourself
A few questions straight from this article.
-
Ellipsoid zone disruption on OCT refers to loss of which structure?
Ellipsoid zone disruption means a break, thinning or loss of the second outer retinal hyperreflective band, and it is one of the most useful structural markers of photoreceptor damage. -
Why does the ellipsoid zone appear as a bright band on OCT?
The band is bright because of the dense mitochondria in the ellipsoid portion of the photoreceptor inner segments. Its loss indicates photoreceptor dysfunction or death, or damage to those mitochondria. -
Which order lists the four outer retinal OCT bands from inner to outer?
From inner to outer the bands are the external limiting membrane, the ellipsoid zone, the interdigitation zone and the RPE-Bruch membrane complex. The ellipsoid zone is most prominent at the fovea, where cone density is highest. -
Which condition produces a parafoveal ring of ellipsoid zone loss with a preserved foveal centre?
In hydroxychloroquine toxicity the retina outside the fovea is damaged first, giving a parafoveal ring of ellipsoid zone loss with the foveal centre preserved. -
In which disease does the ellipsoid zone shrink centripetally to a central island?
In retinitis pigmentosa the ellipsoid zone shrinks progressively toward a central island, and its boundary marks the edge of functioning retina. The width of the residual band correlates with visual field extent and retinal sensitivity. -
What does restoration of the ellipsoid zone after macular hole surgery indicate?
After successful macular hole surgery, restoration of the ellipsoid zone correlates with visual recovery, while eyes in which the band does not recover tend to end with poorer acuity. -
What does parafoveal ellipsoid zone loss signify during hydroxychloroquine screening?
Parafoveal ellipsoid zone loss signals established toxicity and is the reason OCT is recommended in hydroxychloroquine screening. Damage found at this stage is often irreversible, although progression may slow after the drug is stopped. -
What is the main limitation of the ellipsoid zone as a clinical marker?
The ellipsoid zone is a structural marker only. Patients with an intact band can have reduced acuity from inner retinal or cortical disease, and patients with a broken band may keep surprisingly good vision in the short term. -
Which artifact makes the outer retinal bands look faint while the Henle fibre layer turns hyperreflective?
When the OCT beam is not perpendicular to the photoreceptors, the outer bands look faint or interrupted and the Henle fibre layer becomes hyperreflective. Repeating the scan with the beam centred through the pupil avoids the error. -
What should patients be told about structural recovery of the ellipsoid zone?
Serial OCT scans document change, and patients should be told that structural recovery, when it happens, is slow and may lag behind visual recovery.

Writes and reviews the clinical articles on Educate. Every post is checked against peer-reviewed sources before it goes live.