Microperimetry is fundus-controlled perimetry that measures retinal sensitivity at known locations while it tracks eye movements.
Standard perimetry assumes steady fixation, and patients with central scotomas often fixate eccentrically. Microperimetry corrects for this problem, and it links function to structure on OCT and fundus images.
How Microperimetry Works
The device images the fundus in real time with an infrared camera and locks onto retinal landmarks. It then presents light stimuli at chosen points, and the patient presses a button when the light is seen.
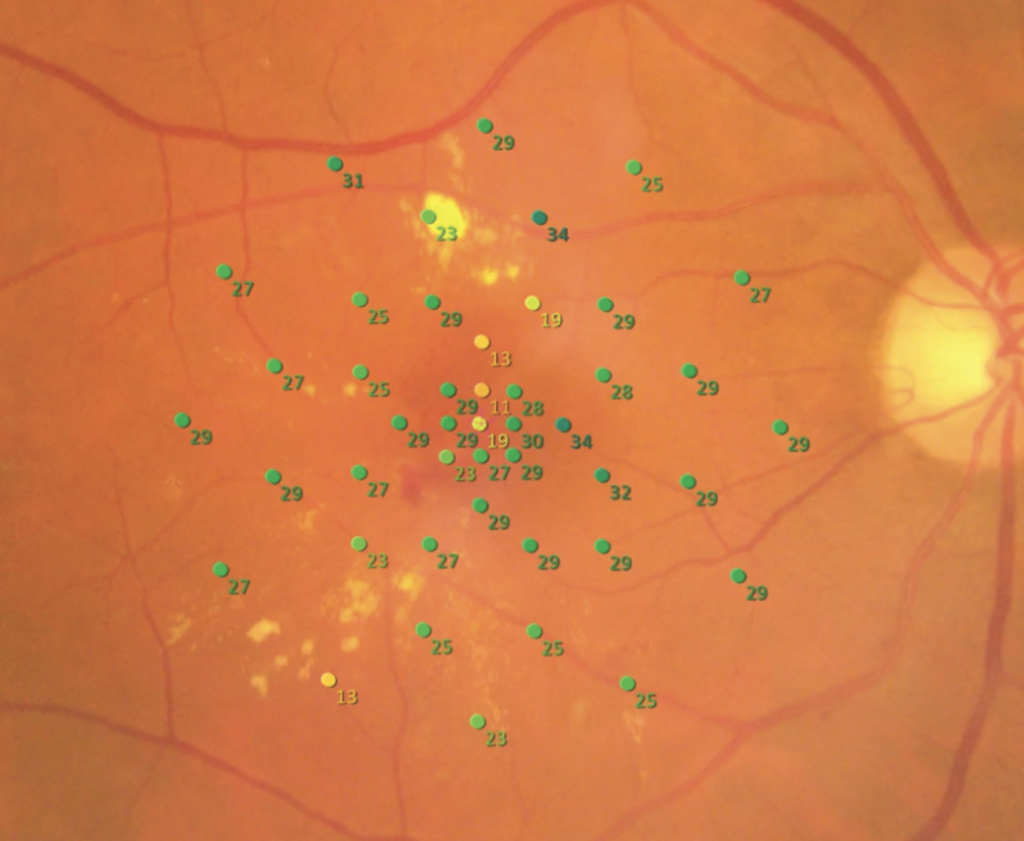
Tracking moves the stimulus with the retina, so each test point stays on the intended tissue. Results appear as a map of sensitivity in decibels, overlaid on the fundus image (see fundus autofluorescence imaging).
Fixation Analysis in Microperimetry
The device also records the position of the fixation point during the test. It reports the fixation location, stability, and the area that contains most fixation points, called the bivariate contour ellipse area.
Patients with central disease may use a preferred retinal locus away from the fovea, and the map shows where it lies. Fixation analysis helps in low vision rehabilitation, since it shows where to place visual aids.
Fundus Explorer Pro
Photograph the retinal findings described here with the phone already in your pocket — 22 D optics and built-in illumination in one handheld unit.
From Choroida — the team behind this siteTest Protocols
Examiners choose a grid, such as a 10-2 pattern, or custom points around a lesion. Typical stimulus size is Goldmann III and the strategy is a 4-2 staircase, while mesopic testing is standard and dark-adapted scotopic testing adds information in rod diseases. Because a learning effect occurs, patients should do a short practice run first.
Clinical Uses of Microperimetry
- Age-related macular degeneration, including geographic atrophy and drusen
- Stargardt disease and other macular dystrophies
- Retinitis pigmentosa and cone-rod dystrophies
- Macular hole, epiretinal membrane, and diabetic maculopathy
In trials, microperimetry gives a functional end point that may detect change before acuity does (see Stargardt disease).
Microperimetry in Age-Related Macular Degeneration
Sensitivity falls over drusen and in areas of atrophy, and the loss often exceeds what acuity suggests. Markowitz and Reyes reviewed the evidence and found that microperimetry correlates with structural change. Test-retest variability is notable, so changes need to exceed the repeatability limits to count (see geographic atrophy treatment).
Limits of Microperimetry
- Long test time and fatigue
- Learning effect and variable cooperation
- Limited dynamic range in some devices
- Device-specific normal values
Therefore, interpret results with caution, and repeat the test when findings are unexpected.
An Example Case
A 72-year-old woman with geographic atrophy in both eyes has acuity of 20/60 and reads slowly. Microperimetry shows dense scotomas in the central 4 degrees and a preferred retinal locus above the atrophic area.
The low vision team uses this map to train her to look slightly below the target, and her reading speed improves. Repeated tests every six months show stable sensitivity over several visits, and the map guides her follow-up.
Questions Patients Ask
Patients ask why they need another visual field test, and the answer is that this test shows exactly where the retina sees. They also ask whether the test is tiring, and the session lasts about ten minutes per eye, so offer short breaks and a quiet room because attention affects results.
Pitfalls to Avoid
- Testing before dilation or in poor lighting without noting it
- Skipping the practice run, which inflates the learning effect
- Comparing results between devices with different stimulus ranges
- Reading small changes in sensitivity as real change without checking repeatability
Looking Ahead
Faster algorithms and scotopic testing are entering routine devices, and researchers also use microperimetry as an outcome in trials of geographic atrophy and gene therapy. Therefore, expect broader use as normative data grow.
Practical Points
Record the device, the grid, and the stimulus settings in the chart, then compare each result with the previous one using the same protocol. Also store the fundus image with the map, so that the findings link to structure.
Combining Microperimetry With OCT
Overlay the sensitivity map on the OCT to see which layers match each scotoma. Because outer retinal loss predicts low sensitivity, many centers report both findings together. Then use the combined picture to explain symptoms to the patient, and also record the fixation pattern, since it guides rehabilitation.
Training and Staffing
Train a technician to run the test, and use a standard script for instructions. Because results depend on how the patient understands the task, check comprehension before starting, and then audit repeatability from time to time.
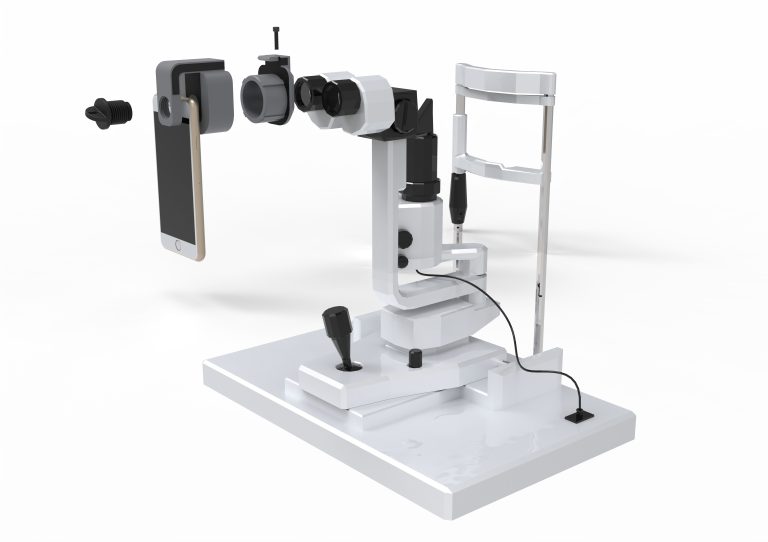
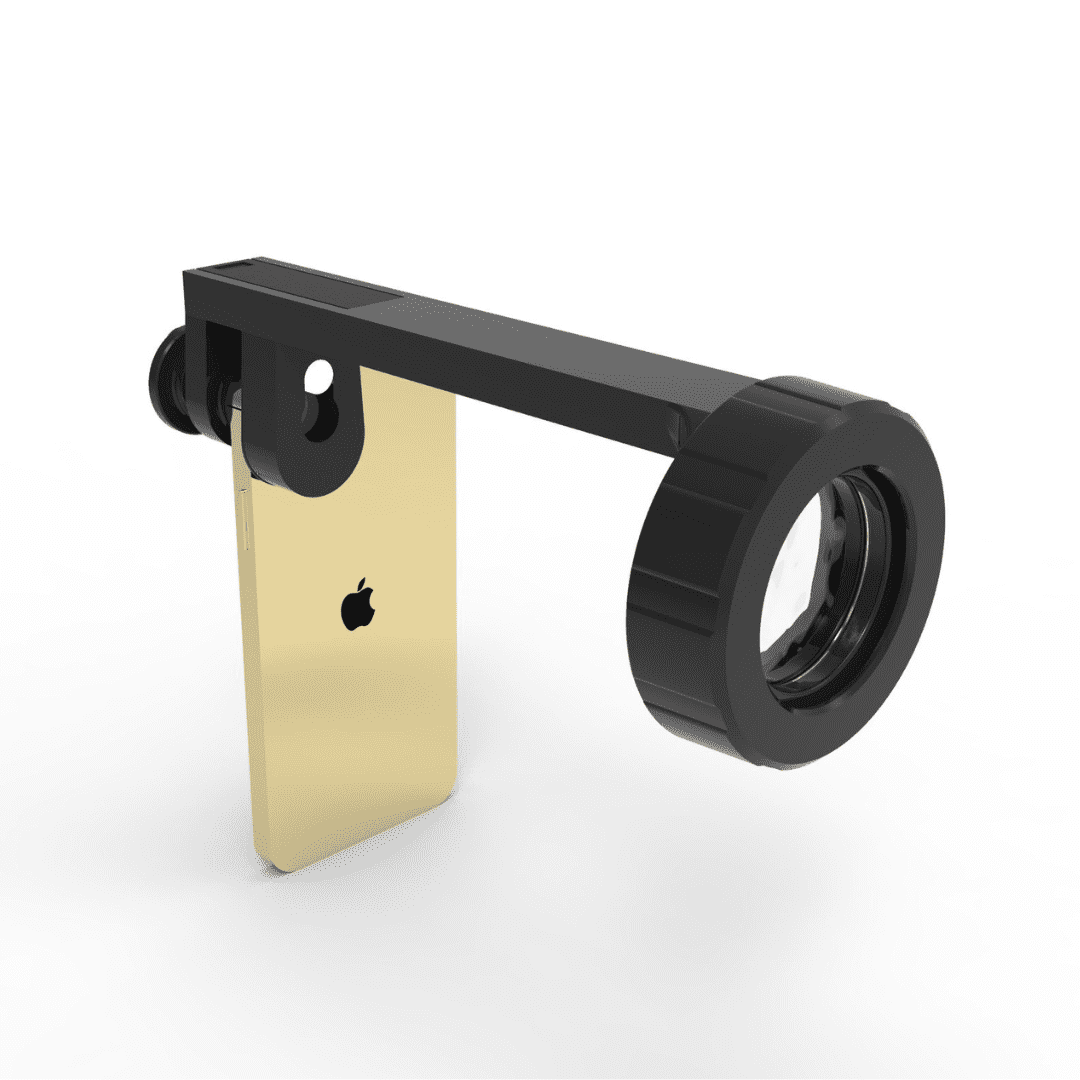
Document what you see
Two smartphone imaging tools built for everyday clinic use — one for the slit lamp, one for the fundus.
From Choroida — the team behind this siteReferences
- Markowitz SN, Reyes SV. Microperimetry and clinical practice: an evidence-based review. Can J Ophthalmol. 2013;48:350-357.
- Midena E, Radin PP, Pilotto E, et al. Fixation pattern and macular sensitivity in eyes with subfoveal choroidal neovascularization secondary to age-related macular degeneration: a microperimetry study. Semin Ophthalmol. 2004;19:55-61.
- Wu Z, Ayton LN, Guymer RH, Luu CD. Intrasession test-retest variability of microperimetry in age-related macular degeneration. Invest Ophthalmol Vis Sci. 2013;54:7378-7385.
- American Academy of Ophthalmology. Basic and Clinical Science Course, Section 12: Retina and Vitreous. AAO; current edition.
Test yourself
A few questions straight from this article.
-
Which description best defines microperimetry?
Microperimetry measures retinal sensitivity at known fundus locations while tracking the eye, which corrects for the eccentric fixation that undermines standard perimetry in central scotomas. -
How does microperimetry keep each light stimulus on the intended retinal point during testing?
An infrared camera images the fundus in real time and locks onto retinal landmarks, so the stimulus moves with the retina and stays on the intended tissue. -
In microperimetry fixation analysis, what does the bivariate contour ellipse area describe?
The device records the fixation point throughout the test and reports its location, its stability and the bivariate contour ellipse area, the area that holds most fixation points. -
Locating a preferred retinal locus on microperimetry is chiefly useful for which clinical purpose?
Patients with central disease may fixate with a preferred retinal locus away from the fovea; mapping it shows the low vision team where to place visual aids and how to train fixation. -
Which stimulus size and threshold strategy are typical for microperimetry testing?
A typical microperimetry protocol uses a Goldmann III stimulus with a 4-2 staircase, on a grid such as a 10-2 pattern or custom points around a lesion. -
Dark-adapted scotopic microperimetry adds most information over standard mesopic testing in which disease group?
Mesopic testing is the standard microperimetry condition, while dark-adapted scotopic testing adds information in rod diseases. -
Which step reduces the learning effect that distorts microperimetry results?
Microperimetry shows a learning effect, so patients should do a short practice run first; skipping it inflates the effect. -
In age-related macular degeneration, how does microperimetric sensitivity loss over drusen and atrophy compare with visual acuity?
Sensitivity falls over drusen and in atrophic areas, and the functional loss often exceeds what acuity suggests, which is why microperimetry may detect change before acuity does. -
When should a change in microperimetry sensitivity in macular degeneration be counted as real progression?
Test-retest variability is notable in microperimetry, so a change must exceed the repeatability limits before it counts as real change. -
When a microperimetry sensitivity map is overlaid on OCT, loss of which retinal component predicts low sensitivity?
Outer retinal loss on OCT predicts low microperimetric sensitivity, so many centers report structure and function together and use the combined picture to explain symptoms.

Writes and reviews the clinical articles on Educate. Every post is checked against peer-reviewed sources before it goes live.